Modeling Toxins and Urban Areas
The Lafyette Loess Plains ecotone encompasses an urban area, at least as it is defined by the Census Bureau. I discovered this while analyzing a DEM file in GIS. Within my assigned ecotone I decided to map the urban areas as well as toxic inventory sites. The aim was to see how the two overlapped with the underlying idea that if toxins were released where woud the accumulate and would it be in the areas that would effect the greatest number of people. According to the cursory research that i conducted the greastes density of people was nearest to the waterbodies which could potentially serve as a thoroughfare for toxins. All of the inventory sites in my quadrant were relatively close to urban areas.
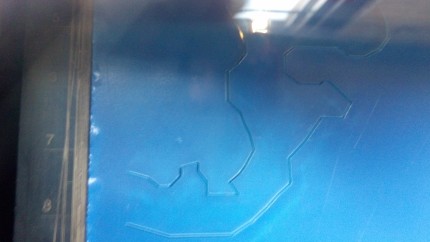
In working through the commands in Rhino i only slightly altered the depth of the water bodies so that they would be present in the model but i did not want to exaggerate the vertical scale in a way that would distract from the true terrain and ultra flat landscape of my region. The 3D rhino model was then converted into contours and printed on acrylic in the laser cutter.
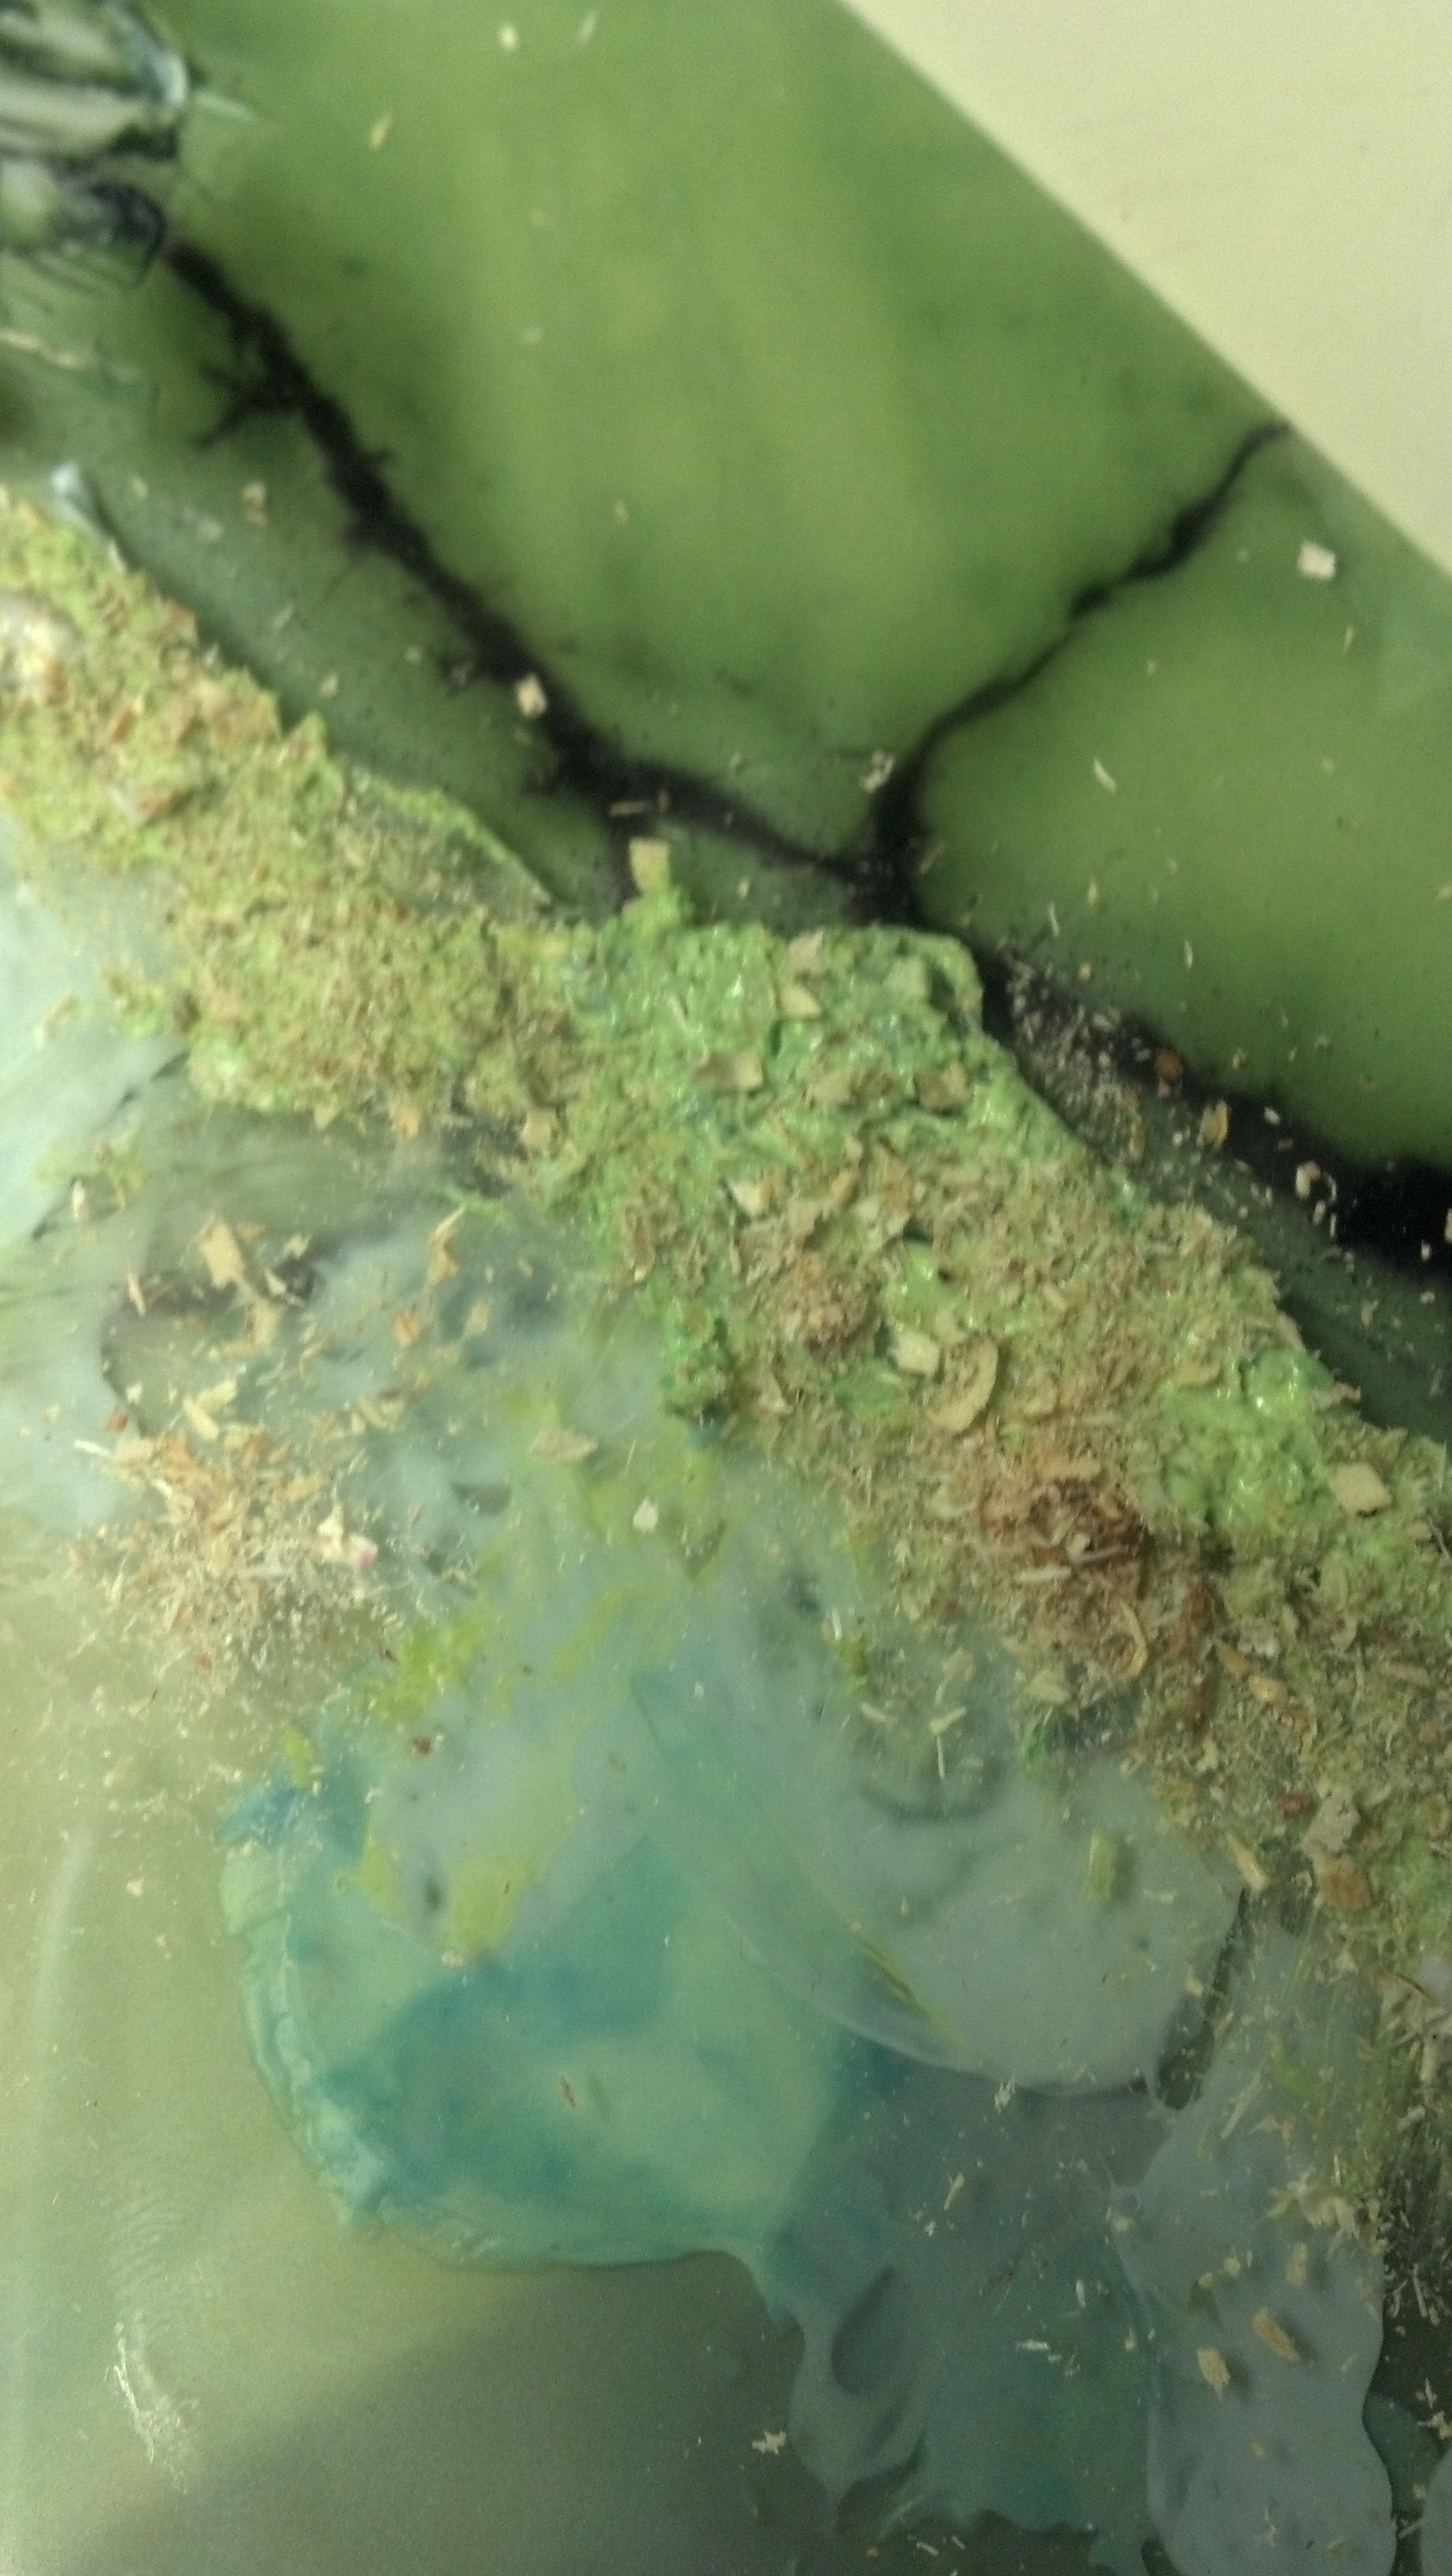
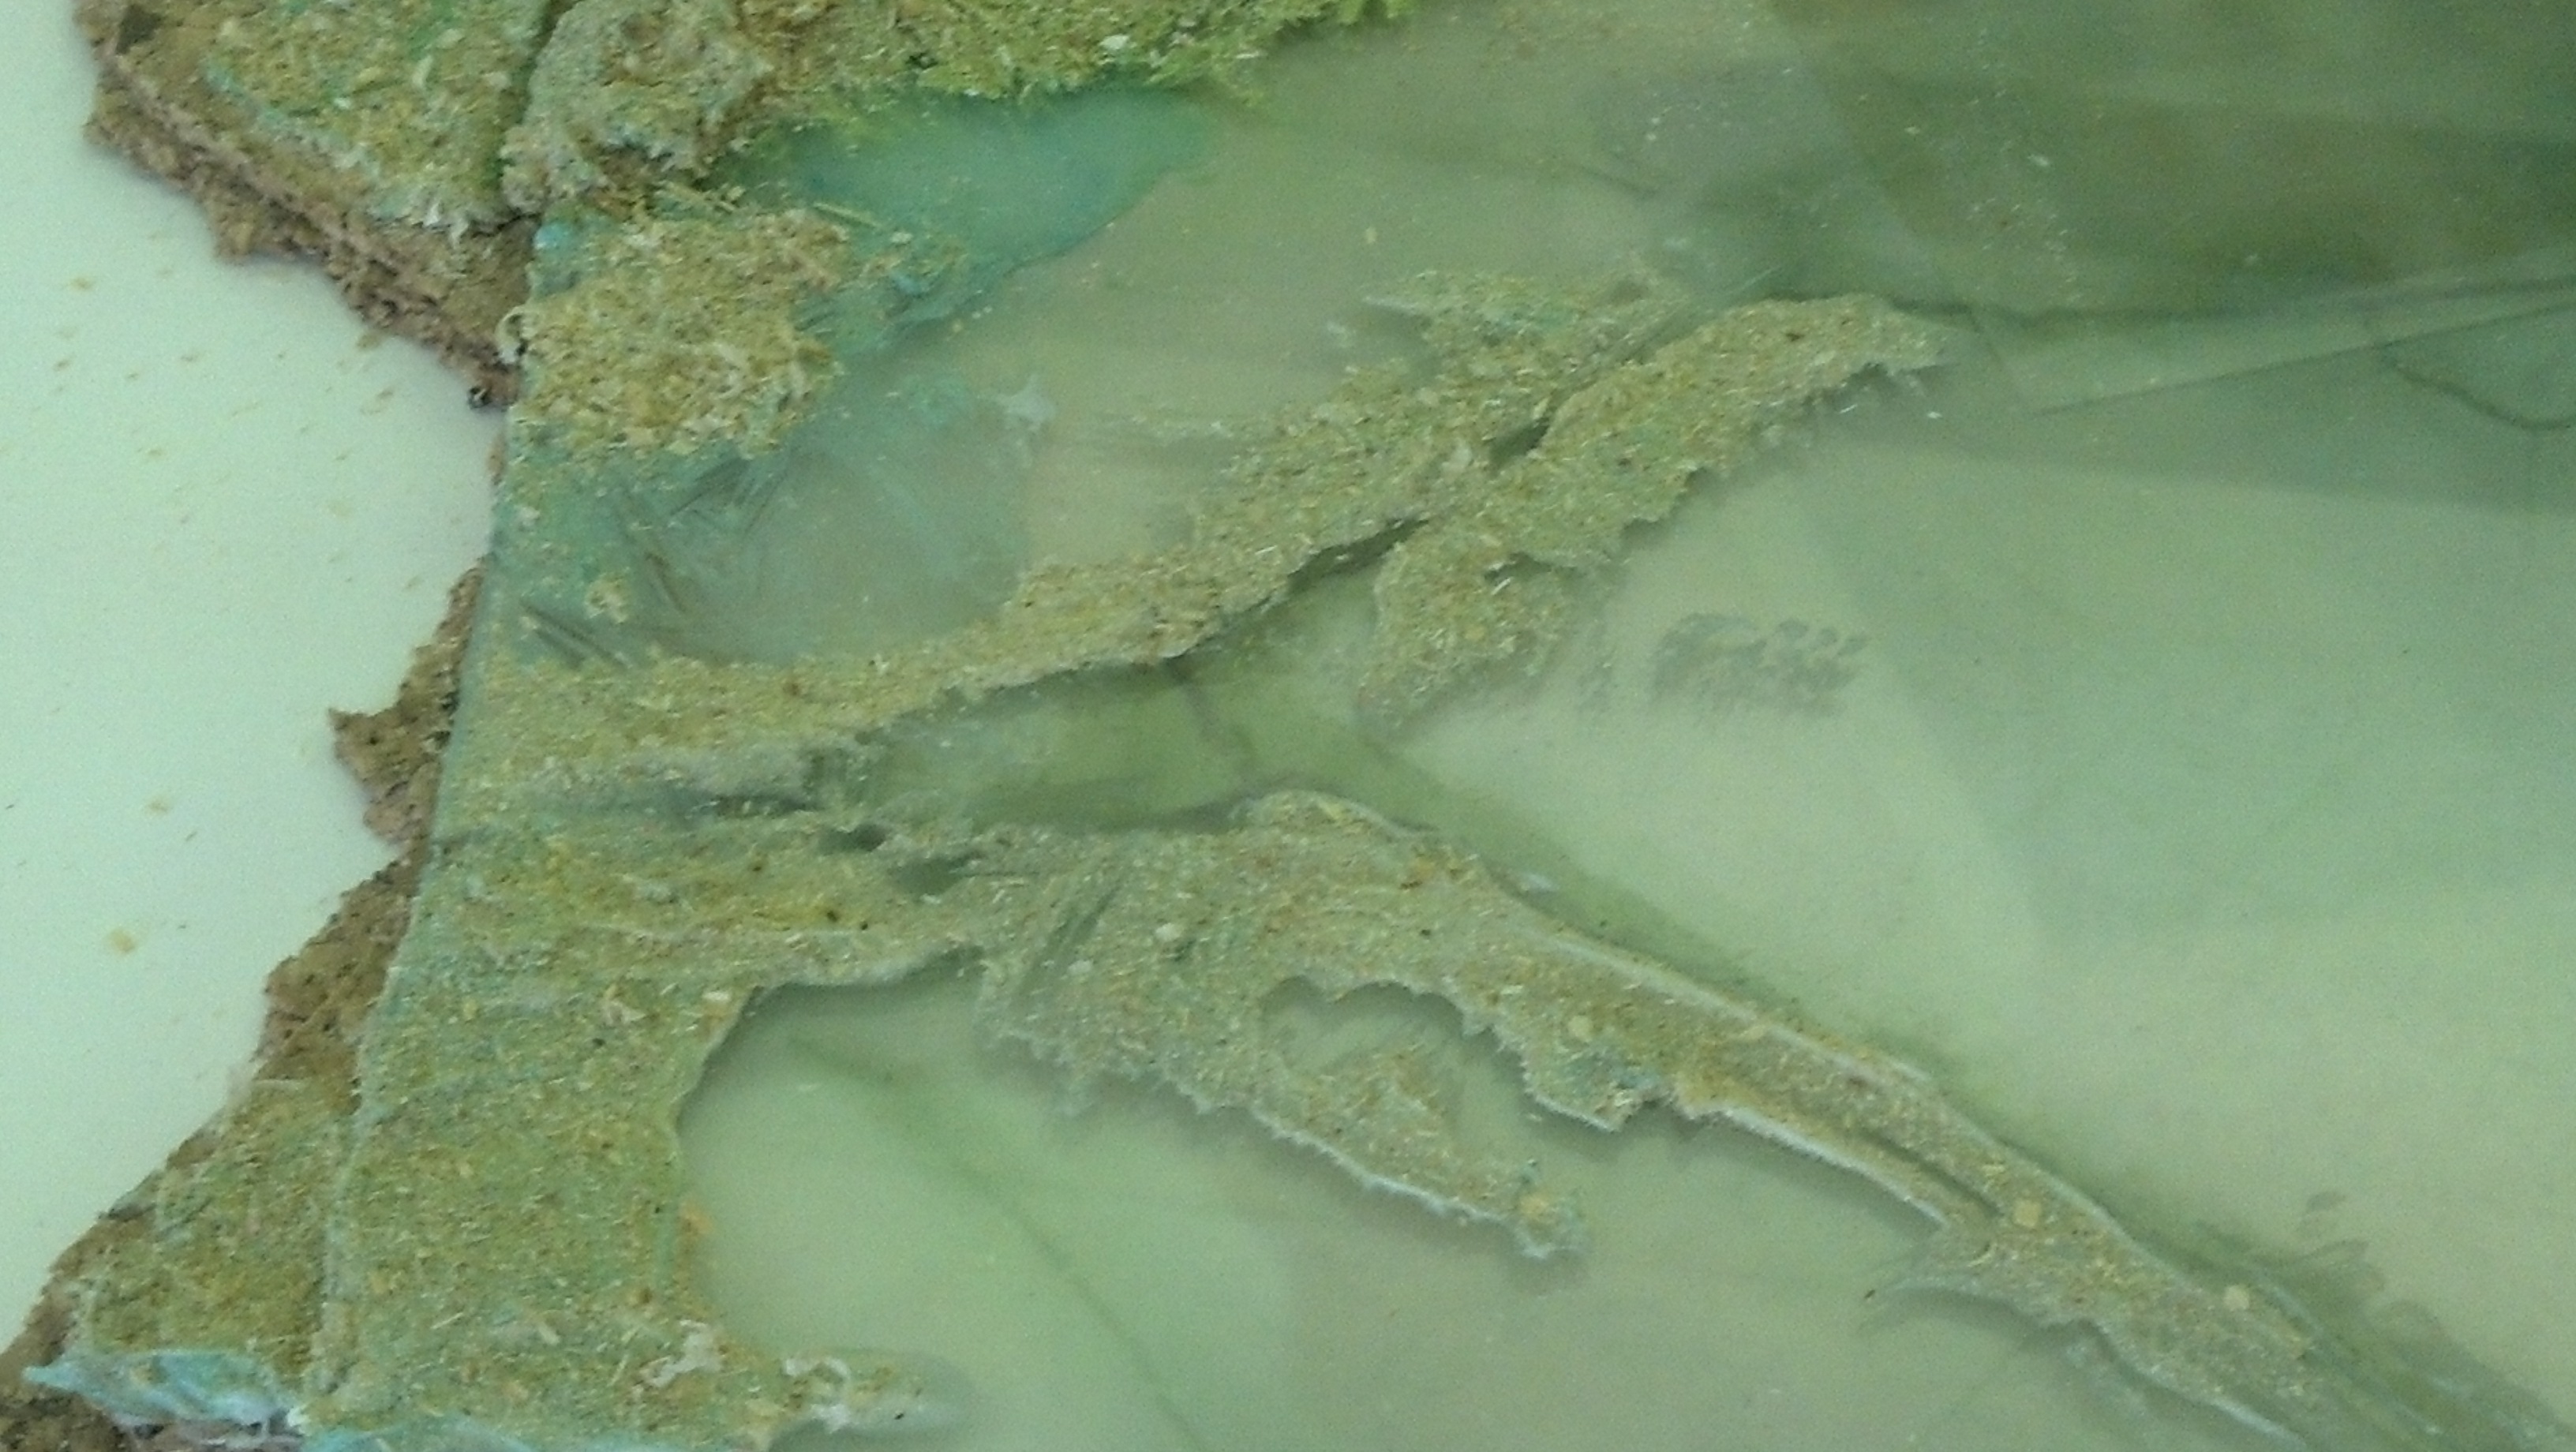
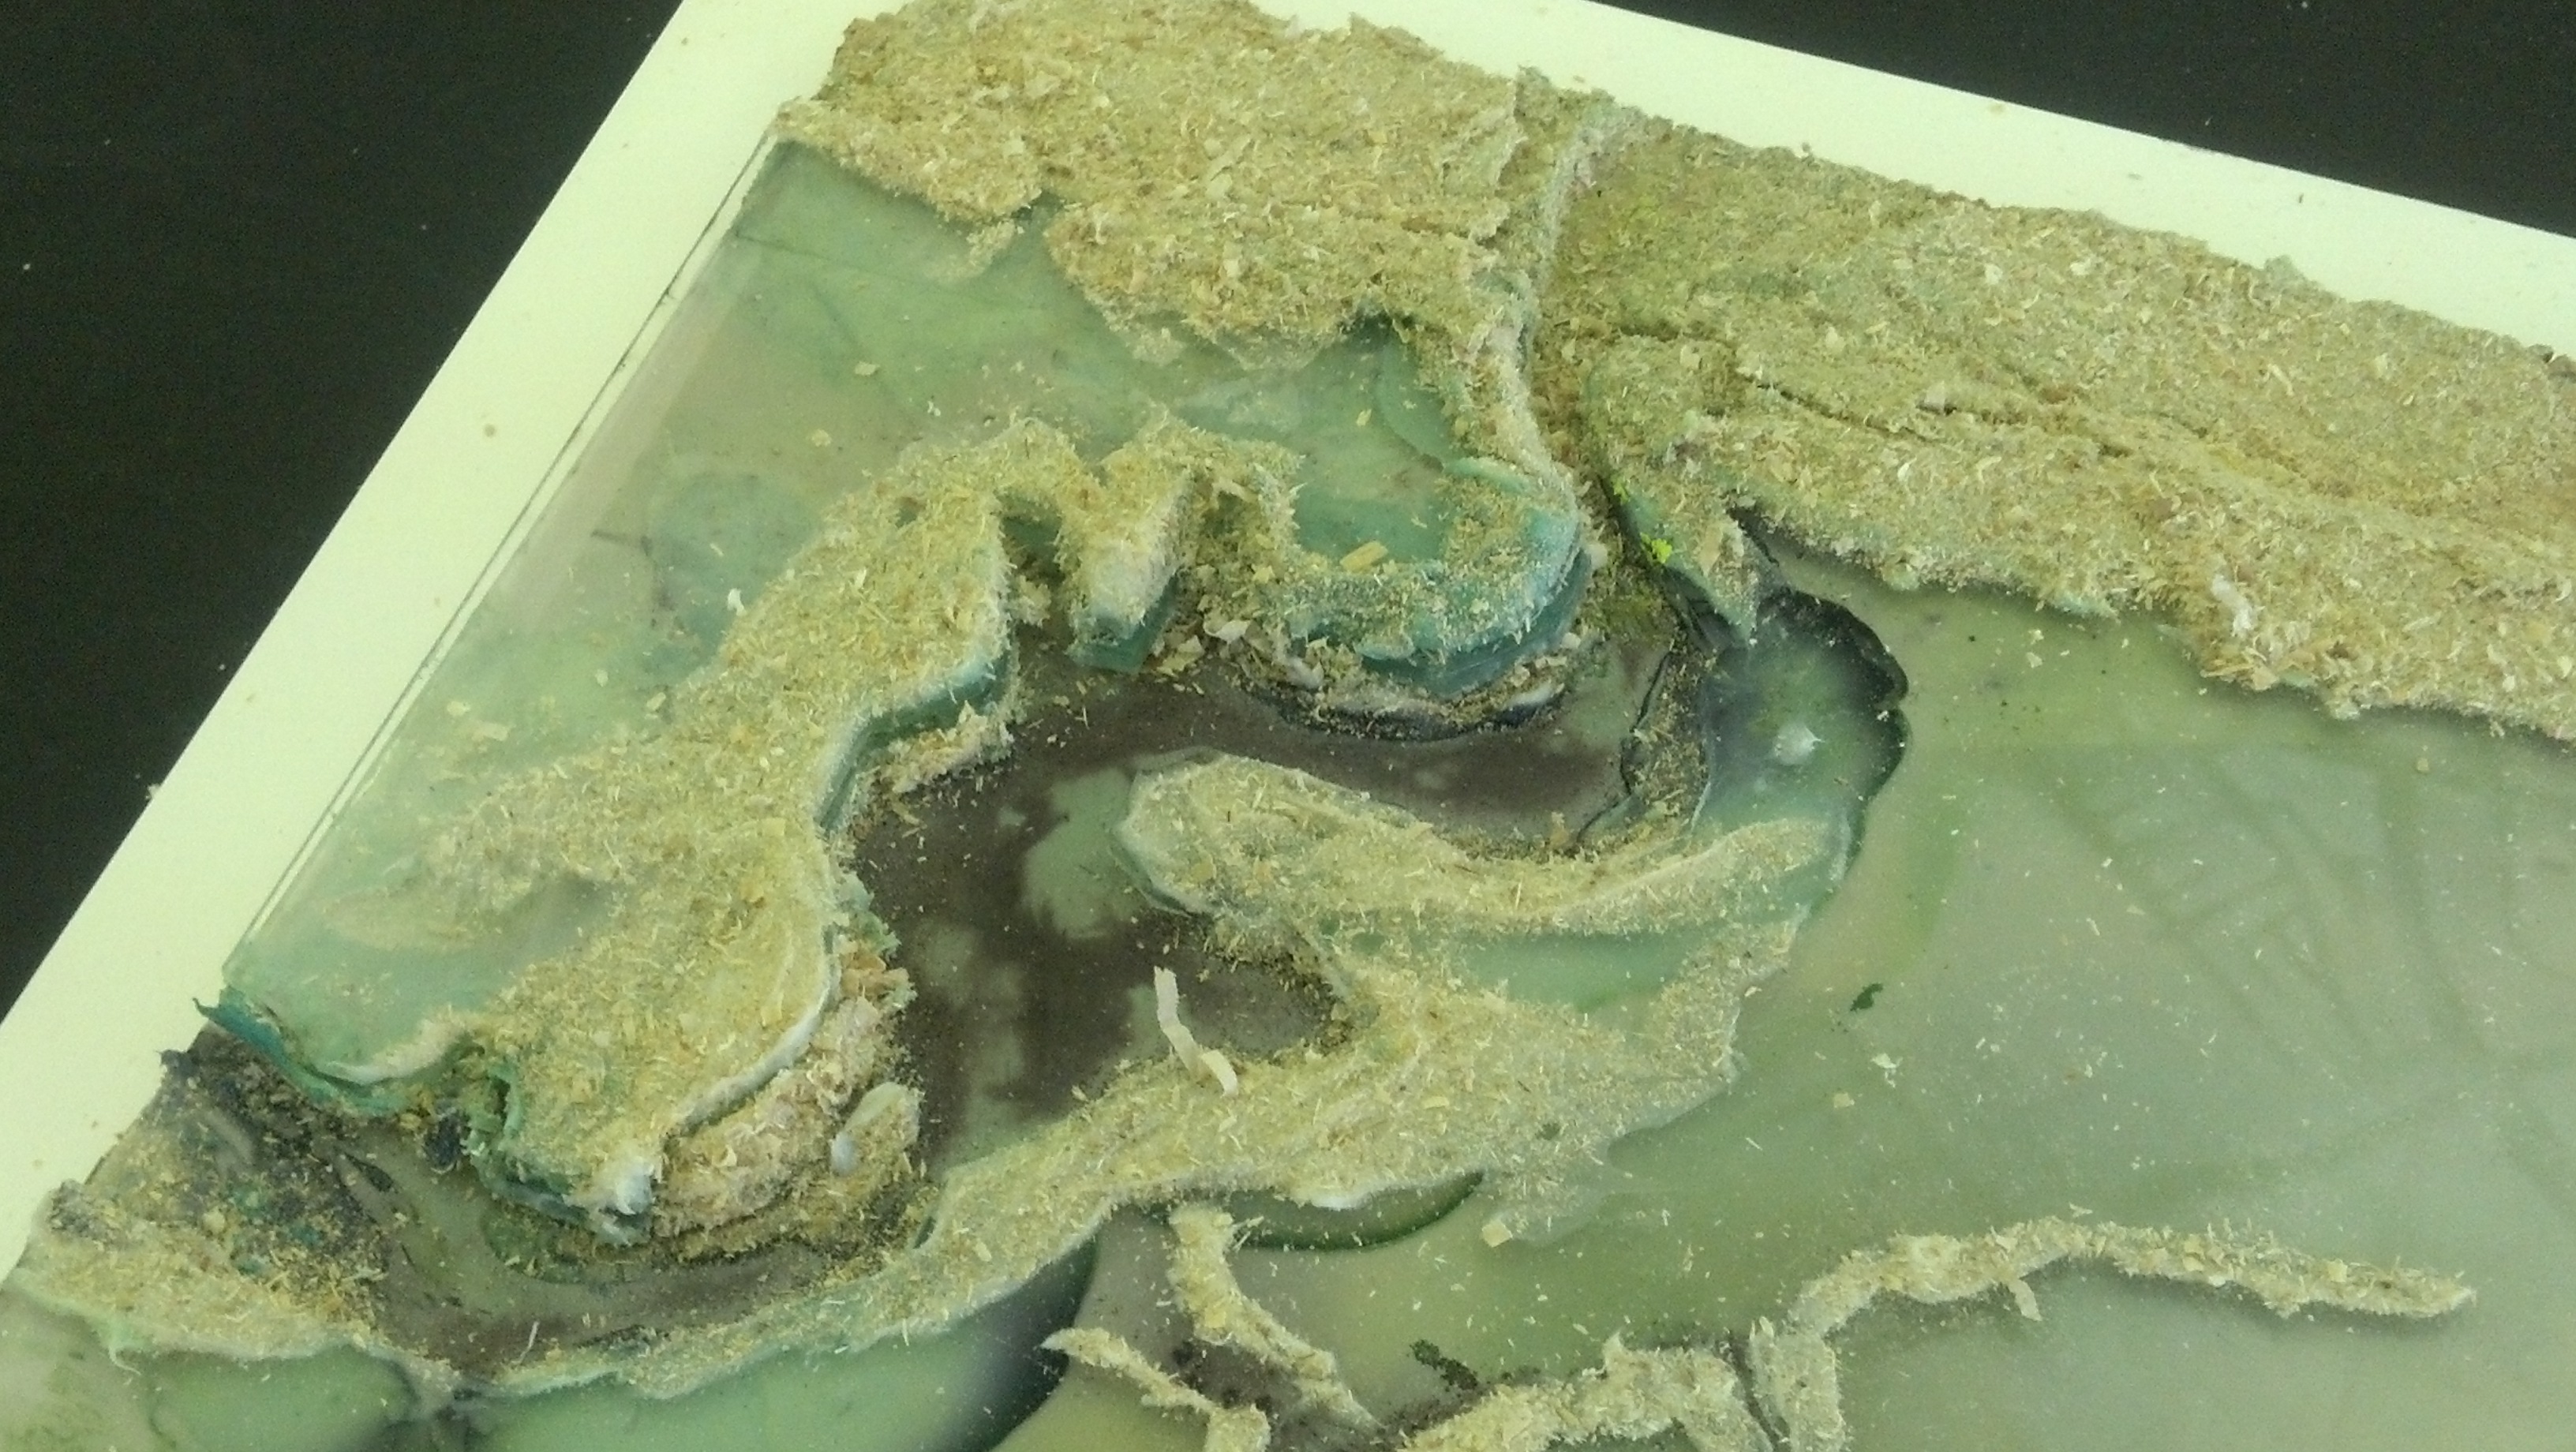
The harsh lines of the contours did not represent the river, spoil banks and overall form that i felt best showed the subtle character of my particular landscape and so i found analog layers to be equally important in modeling the terrain. The final model include model paste, sawdust, paint, printed vellum and transparencies. Each layer representing the context and toxic potential of the site.