-
Framework Prototype revisited
Iteration 1: Conceptual Prototype of different energy sources’ consumption over time and acceptance over time. A full built model could utilize clear acrylic in place of the particle board as well as colored lines. Casting in resin also an option as are acrylic laser-cut cross members. – Iteration 2: Study charting multiple energy sources (algae, wind, solar, bio-fuels, hyrdogen, […]
-
{prototyping}
something is happening… prototype 1.0: section model of transect from golden meadow to port fourchon This was my first pass at modeling a transect of the ecology of the oil infrastructure + ecology of the wetlands. The sections are at 1″:40′ which still doesn’t allow for much area of the terrain to be included. The […]
-
prototype storyboard v1
[storyboard] This is the first storyboard version. Basically, it starts from the framework to introduce basic data and research about golf courses. Then it shows ways to improve water system of Audubon golf course. As discussed in the framework part, the course could provide some areas like golf ponds or other lowland areas as water […]
-
Molecular Visualization
The following posts include prototypes for modeling styles relevant to our project. Our project representation will show and explain pollution of water systems from agricultural sites. There are many media styles using 3D Studio Max and Particle Flow to show pollution and molecular infiltration not only as objects, but as systematic and active process. Perhaps […]
-
prototype sample [experience]
[experience] This sample is to show the experience of a void golf pond turning to a bird island. The space of those golf ponds could be more responsible for the overall ecological habitats. The sample is created by 3ds max and vue. I use 3ds max to create the terrain part and vue to create […]
-
Prototypes
Our first prototype is a 3D diagram for the Framework of Algae Cultivation. It is comprised of chipboard that has been cut with the laser cutter in the woodshop. The basic shape is a line graph of all CO2 emmisions from 1752 to Present. The narrow side represents the acceptance rate of algae fuel over […]
-
{experience}
This is the most ephemeral component of the project. I would like to be able to capture the experience of dynamic processes process involved. Perhaps there is a way to condense time to express one location at various moments so that systems which operate at a humanly imperceptible speed may become visible. For example, the […]
-
{framework}
Louisiana’s oil and gas infrastructure is a complex system. As a physical infrastructure it consists of wells, pipes, off-shore oil rigs, refining stations, submerged barges, and other technologies. I would like to better understand the intersection between these built and natural ecologies and explore the dynamic processes that result from the evolving interface between the […]
-
Visualizations
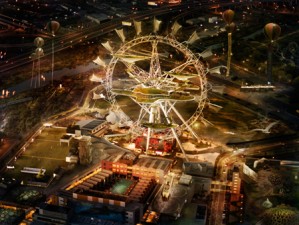
Several examples of animations/illustrations that provide interesting methods for visualization. Hyper-real architectural visualization. Squint/Opera Melbourne Future Wheel Illustration
-
Creating a Terrain with the Displace Modifier
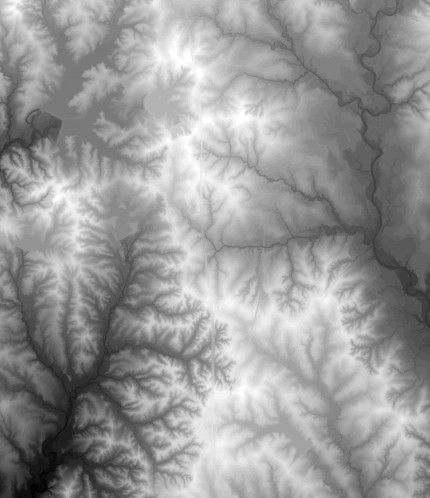
First you will need to get a Digital Elevation Model (DEM) of a specific location. In this case we are using a DEM of the NW Laurel Hill (Louisiana) USGS quadrant. You will need to convert the DEM file into an image file (such as jpg) using GIS. Black represents low areas, white represent high areas. Check […]


