Fertilizers and their Impact on Watershed Ecology
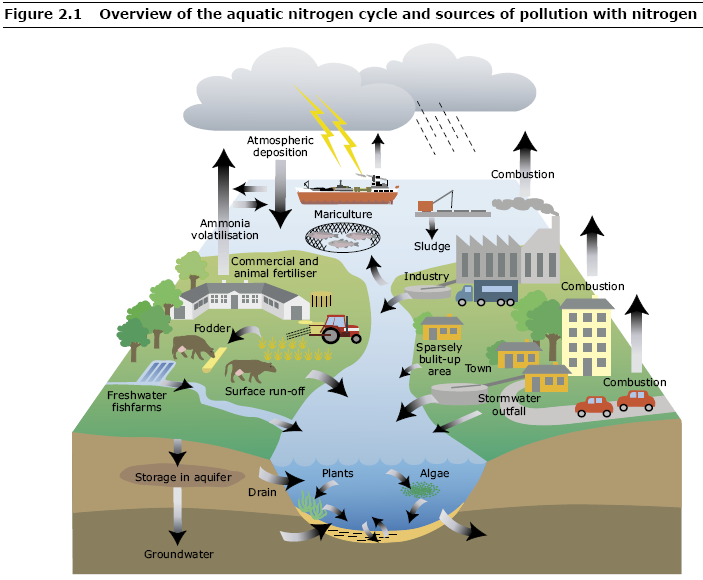
Nitrogen and phosphorus pollution ranks as one of the top causes of degradation in some U.S. waters for more than a decade. Large amounts of nitrogen and phosphorus lead to regional water quality problems like algal blooms, hypoxia and declines in wildlife habitat.
“Aerobic conditions” in water ways signifies the presence of oxygen in a hydrological system. The natural cycles of the water feature may be more or less in balance until an excess of nitrate, or nitrogen, and/or phosphate enters the system. At this time, water plants and algae begin to grow more rapidly than normal. There is also an excess die off of plants and algae as sunlight is blocked at lower levels. Bacteria try to decompose the organic waste, consuming the oxygen, and releasing more phosphate which is known as “recycling or internal cycling”. Some of the phosphate may be precipitated as iron phosphate and stored in the sediment where it can then be released if anoxic conditions develop.
Industrial agriculture is a leading cause of water pollution in the U.S. In the 2000 National Water Quality Inventory conducted by the Environmental Protection Agency (EPA), agricultural activity was identified as a source of pollution for 48% of stream and river water and for 41% of lake water. Many small sustainable farms conserve water and apply waste and fertilizer to fields responsibly, minimizing their impact on local water systems.
Framework
In order to establish a point of reference for modeling various methods of combating contamination of runoff and filtration processes, we will model existing conditions of a watershed within an agricultural region. This agriculture practices modeled in this section will consider base agricultural situations with no consideration of runoff treatment or control.
First, a typical watershed will be constructed in 3ds Max. Then the hydrologic properties of the watershed will be modeled using the 3ds Max Particle Flow system. Finally, fertilizer type contaminants (Nitrogen, Phosphorous) will be distributed on the site and both the groundwater infiltration and watershed infiltration. Other factors that will be modeled are soil porosity, crop type, rainfall/irrigation frequency and amount, and vegetation density and type.
Process
The process portion will consist of small scale modeling of the contamination and filtration process of runoff and river systems using a particle flow simulator. The focus in this model will be the exploration and experimentation of various runoff containment and filtration strategies. Some examples that will be modeled are on-site detention, vegetated filters, and synthetic filtration systems. The effectiveness of each model will be analyzed to determine the strengths and weakness of each method.
Experience
The information gathered from analysis of the first two sections will be synthesized into the basis for a comparative model. This model will be presented in such a way that clearly represents the difference in impact on watershed ecosystems when exposed to both untreated and effectively treated agricultural runoff. This model will give viewers a firsthand demonstration of the dispersing of contaminants and the chain of effects these contaminants create on a watershed.
Sources:
http://www.epa.gov/waterscience/criteria/nutrient/
http://www.sustainabletable.org/issues/waterpollution/
http://www.eea.europa.eu/themes/water/water-pollution/figures-and-maps/sources-of-pollution/

