002 . Point/Grid . Digital Site Modeling
Diana Quintero de Saul DAL
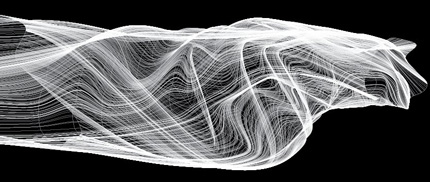
Based on the analog site mapping students will reinterpret the virtual grid across the site. The grid will be transformed based on recordings taken from the site in the previous exercise with transformations taking place on the grid points, polys(cells), and edges. The transformations will take place based on the recorded data; binary (off/on), value (amplitude), vector (movement, change). This will require a quantification of the information represented in the previous exercise in order to create a range of values that will be clearly applied to the transformations.
1. Quantify site mapping and interpolate data across the site from your colleagues mappings. This will require the interpretation of the entire classes work in order to develop a data set based on each point of the grid. The data set should have a defined range of values that may be applied to a variety of transformations.
binary . consisting of two or based on two
range . an area in which something acts or operates, the distance or area or volume over which something extends, a bounded scope.
amplitude . the property of relative size or extent
vector . a line traced by a point traveling in a constant direction; a line of zero curvature, a straight line segment whose length is magnitude and whose orientation in space is direction.
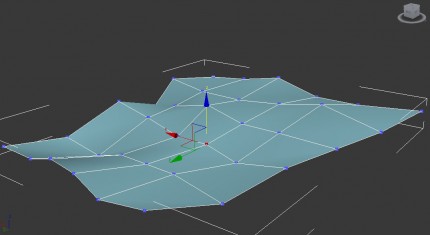
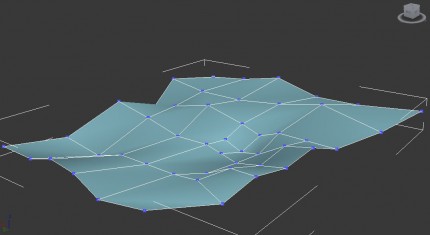
2. Using the provided site model each point will be given a value that defines the points Z elevation to create a site topography that expresses the site phenomena. This topography will be an abstraction of the recorded phenomena as it relates to the datum (0 or ground elevation) and may be in either the positive or negative vertical direction. Depending on how the data is interpreted it is possible to tessellate the grid points in order to further refine the topography and to maintain data fidelity.
operations: transform sub-object vertex on the Z-axis, tessellate sub-object polygons
3. The topography created is a new site representation that will relate each data point by the resulting connections between the edges and polygons. This topography represents a single phenomena across a continuous topology.
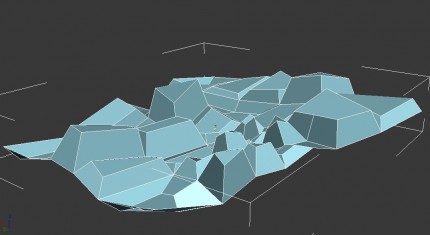
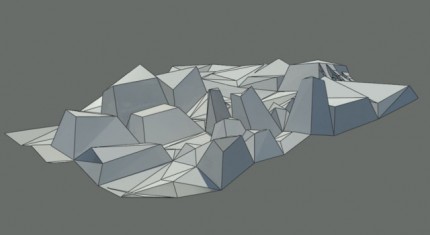
Create a copy of the topography, this will allow for a second iteration that will explore the relationship between the original phenomena and a second phenomena. Using a colleagues data, model a secondary relationship using an extrusion and beveling. This gives up to three transformations to map data to, the vertical height of the extrusion, the beveling of the resulting column, and the xy transformation of the upper horizontal plane, parallel to the lower/upper topography. This procedure should not refine the topography but should instead only attempt to map with the aforementioned transformations.
operations: bevel sub-object polygon, transform polygon on the XY-axes
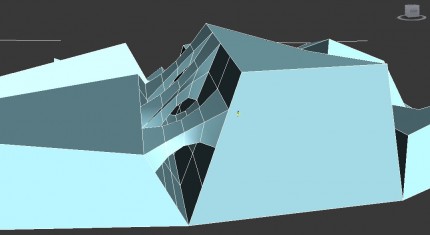
4. Create a copy of the second topography to begin a new iteration that will explore relationships between the mapped phenomena across the site and/or time. This relationship will be explored through modeled horizontal connections between the vertical columns. This will begin with tessellations on the sides of the vertical columns, the number of tessellations and the connections will speak to the lateral connections or time.
operations: tessellate sub-object polygons, bridge sub-object polygon

